As the Crow Flies cARTography
  • Services
  • Map Gallery
    • Antique Maps
    • Bird's Eye View Maps
    • Canadian Geographic Maps
    • Printed Publication
    • Posters
  • Canadian Geographic
  • Clients
    • Our Clients
    • Testimonials
  • About
    • Our Team
    • History
    • Philosophy
  • Contact
  • Blog

Cartographic Alchemy: Charting a course to a greener future.

12/18/2015

0 Comments

 
Over the last decade, I have had the privilege of working with many environmental groups in southern Ontario, and few maps represent this collaboration better than the one pictured here, completed late last month.
Picture
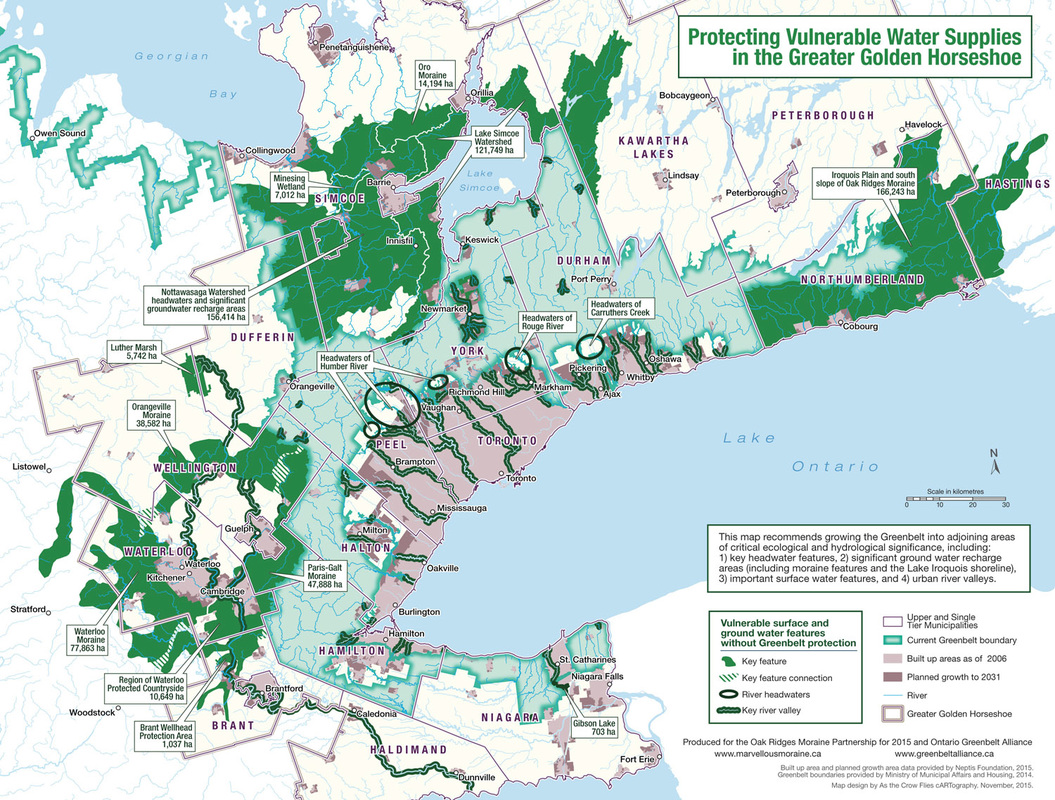
Produced for the Oak Ridges Moraine Partnership and the Ontario Greenbelt Alliance

Ontario's Greenbelt turned ten years old in 2015 and this triggered the first of it's mandated 10-year reviews. A significant feature of the review was the question of whether (and where) the Greenbelt should expand to better serve one of its primary goals: to protect natural heritage and water resource systems. The answer for most environmental groups as to whether the Greenbelt should grow was a resounding yes, but the question of where was a much harder one to answer.

Each group that lent their insights to the creation of this map looked at this question through their own lens. Some saw value in moraines, others in land adjacent to rivers, still others in wetlands and marshes; but the common thread that emerged was the need to focus on water. These answers, while precise in name “Marsh X or River Y”, did not answer the cartographic question of precisely where the boundaries of these features were.

Enter the cartographer.

Defining the boundaries of some of these entities was rather straightforward. Rivers are clearly and correctly mapped in Canada, so defining the vulnerable areas around a river is done simply by buffering the rivers by X meters (a standard digital mapping software task – one or two mouse clicks).

Other definitions proved more challenging. Where exactly were the boundaries of the Waterloo Moraine? There proved to be no definitive answer to this question, so I had to draw on geological map data (areas defined as “hummocky topography” appear to be defining elements of the location of moraines) and make some informed inferences as to just where the edge of the moraine feature was.

And if this seems imprecise, consider for a moment the official provincial definition of the Niagara Escarpment, a dominant natural feature in the southern Ontario landscape and a UNESCO World Biosphere Reserve. On this map, it's mixed in with other features in the southern portion of the Greenbelt, but you can see it's distinct definition as the long thin tendril heading north through Dufferin County and up through Owen Sound. A little cartographic tip: when a natural feature like the Niagara Escarpment is drawn with straight lines, it's been defined by politics (as well as science). It is remarkable to me that a UNESCO World Biosphere Reserve continues to be defined (cartographically, as well as in law) more by a long-ago political negotiation than by geological and ecological features.

And here we find ourselves deep in the alchemy that is drawing boundaries on a map (especially for protected areas). It's a little politics (let's include lands for protection where there's local support), a little science (let's include features that are critical to the healthy functioning of water systems), and a little art (if there's hummocky topography here and also here, the moraine feature probably goes something like this... (cartographer draws line)).

This map, Protecting Vulnerable Water Resources in Southern Ontario, is not meant to be definitive. It is meant to be a jumping off point for discussion. What if we include this feature (and defined it this way)? How would that impact urban sprawl? Would it actually protect the feature we're hoping to protect? These answers are not easily found, and are best answered by a wide range of stakeholders and experts. But without the alchemist (read cartographer), there would be no baseline around which decision-makers could formulate a meaningful vision of what needs to be added to the Greenbelt to help protect our land and our water into the future.

0 Comments

Hasn't everything been mapped already (or why do we need cartographers anymore)?

12/4/2015

3 Comments

 
“Hasn't everything been mapped already” is a question people often bite their tongues not to ask me when I tell them I'm a cartographer. Indeed, this notion was played for laughs in the pilot of the TV show Arrested Development where Buster the slow-witted youngest brother of the Bluth family had gone back to school to become a cartographer (as if there were any need for a cartographer in the 21st century).

While there is precious little “uncharted territory” left on the planet in 2015, there remains an infinite number of things yet to map. To understand how this is possible, you have to understand the difference between a base-map, and a story-telling map.

Road maps, topographic maps and standard school wall maps are all base-maps. They are carefully designed to present familiar map features (rivers, lakes, roads, towns) in a distinctly non-hierarchical way – each element having essentially the same visual importance. Although base-maps continually need updating as humanity changes the face of our planet, for all intents and purposes we have base-mapped most of the world.

But base-maps are just the tip of the cartographic iceberg. The real magic of cartography happens when you layer other information within and around the roads and rivers. When you make conscious visual choices to emphasize one element over another. Consider the three maps below, showing the same piece of land on the Saskatchewan/Manitoba border.
Picture
Contains information licensed under the Open Government Licence – Canada.
This first map is a fine example of a base map from the Atlas of Canada, and gives you the basics of roads, rivers and lakes and the names of each of these elements. Solid base information, but not much of a story.
Picture
Contains information licensed under the Open Government Licence – Canada.
This second map is one of Natural Resources Canada's National Topographic Maps (clearly meant to be printed much larger so you can read the text) but again you see basic elements of road, river and lake and a real effort to show everything with a relatively equal visual weight.  This map does layer in the forested area in green, and topographic contour lines, but like all good base maps it is generic -  making this area look much like any other place in Canada.
Picture
Map: Chris Brackley/Canadian Geographic.
Now consider this third map which I made to accompany a story in Canadian Geographic about a broad range of issues facing the Cumberland Delta, and it's predominantly First Nations population. The story described how lush and biodiverse the Delta was, and also how affected the First Nations communities had been by the E.B. Campbell Dam, given their strong connection to the water as a source of sustenance and livelihood.

To support this story, the map mirrors it's focus. The delta (or stage on which this story takes place) is delineated in light blue.  The water and the First Nations Reserves, as the focal point of the story,  are visually dominant rendered in deep dark colours. The background has a lush, and life-filled green colouration, both for the forest (dark green) and wetland areas (lighter green) visually supporting the idea that this is a rich and diverse landscape. As a rich cartographic piece, it even includes contextual and curious information like the fact that there is agricultural land (yellow) this far north in the middle of a wetland.

Looking at this map, even without reading the article, you can begin to imagine what it might be like to be there – and as such, this is an immersive “take you there” style of cartography – probably my favourite.  Of course there are lots of other cartographic methods that help to tell different kinds stories, so I hope you'll stay tuned for more blogging from me in the coming weeks where I'll try and further my argument that there is still a need for cartographers in 2015.
3 Comments

    Chris Brackley
    Lead Cartographer ATCFC

    My passion for maps runs deep, and this is the forum for sharing my cartographic enthusiasm with you.

    Archives

    January 2016
    December 2015

    Categories

    All

    RSS Feed

Tell your story, your way with a professionally designed map.  
Contact us today for your free quote.
Picture
Have a question about your mapping needs? 
Ask us, we'll get back to you right away!
Submit
Mailing Addres:
As the Crow Flies Cartography
PO Box 185
Georgetown PO Main, ON
L7G 4T1
CANADA


905.702.9080
info@atcfc.ca
ABOUT US
Our Team
History
Philosophy

Contact Us

MAPS
Antique Maps
Bird's Eye View Maps
Canadian Geographic
Printed Publication
Posters 
YOUR STORY
Services
Clients


THE CROW'S BLOG
TESTIMONIALS
How do I get started?
ATCFC.ca © 2022 Privacy Policy